Smart Corridor Design
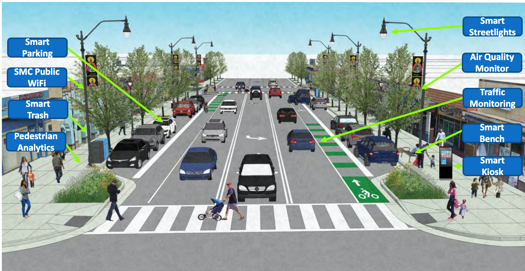 Situation: A half mile (fifteen block) section of a busy road in San Mateo County is undergoing a two year major renovation. When completed in 2023, the street improvement project will create a safer, more accessible and community friendly thoroughfare for residents, business owners, and visitors. Improvements include undergrounding the utilities lines, replacing sanitary sewer lines, upgrading the streetlights, replacing the trash cans, making changes to the roadway configuration to provide wider sidewalks, seating areas, bike lanes, and additional parking, along with landscaping and other street and road improvements.
As part of the improvements, county-owned fiber lines will be installed to connect a 15 node SMC Public WiFi access point network. County, community and political leaders wanted to leverage this digital infrastructure to bring innovative services and solutions to the residents of this underserved community.
In partnership with SMC Labs, we were challenged with adding a layer of innovation and smart city technology to the existing road improvement project that would improve pedestrian safety, operational efficiency, provide better insights into the road’s usage, and add to the existing streetscape and visitor experience in a positive way.
Approach/Solution: We reviewed the goals, community needs, and design of the original street improvement project in order to establish a working baseline. From there, we created a vision and “user experience” narrative of what the “smart corridor” will do for the community. We then translated that narrative into a smart corridor design, identified relevant use cases and solutions that support the narrative, and established a budget and timeline for the implementation. Because these innovative services are diverse, we also identified owners across the county departments who will be responsible for operating and maintaining the services after construction.
Result/Outcomes: The smart corridor design was enthusiastically accepted by county, community and political leaders, and was given formal approval and funding to proceed. The construction phase of the Middlefield Road Improvement project started in May 2021, and with a completion date in 2023. The smart corridor overlay to the project started in July 2021. Strategy of Things will integrate the smart corridor design into the original street improvement project and construction, and actively participate in its design, implementation, testing, project management and launch over the next two years.
Additional Information:
Middlefield Road Improvement Project Website
Fact Sheet for the Middlefield Road Improvement Project
San Mateo County Smart Region
Situation: San Mateo County is located in the San Francisco Bay Area. It occupies 455 square miles, and is home to 20 cities, 29 county agencies, and more than 764,000 people. Many of the challenges the county faces are complex and regional in scope, and is beyond the means and charter of any one city to solve. San Mateo County wishes to incorporate innovation and "intelligent" technologies into its day-to-day operations to proactively and efficiently address the needs of its residents, businesses and residents.
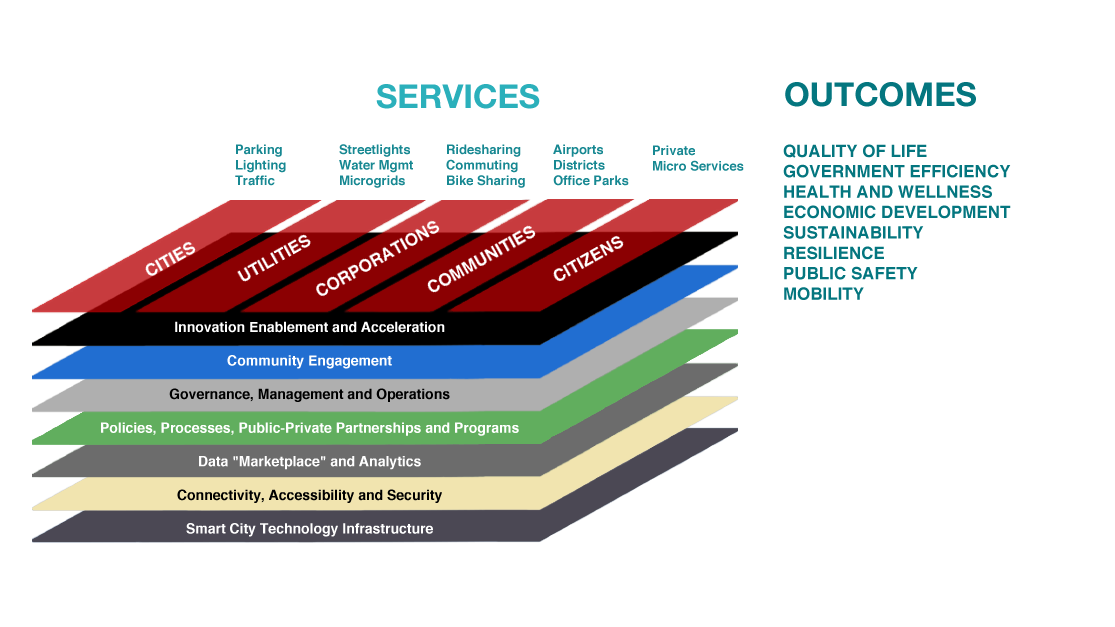
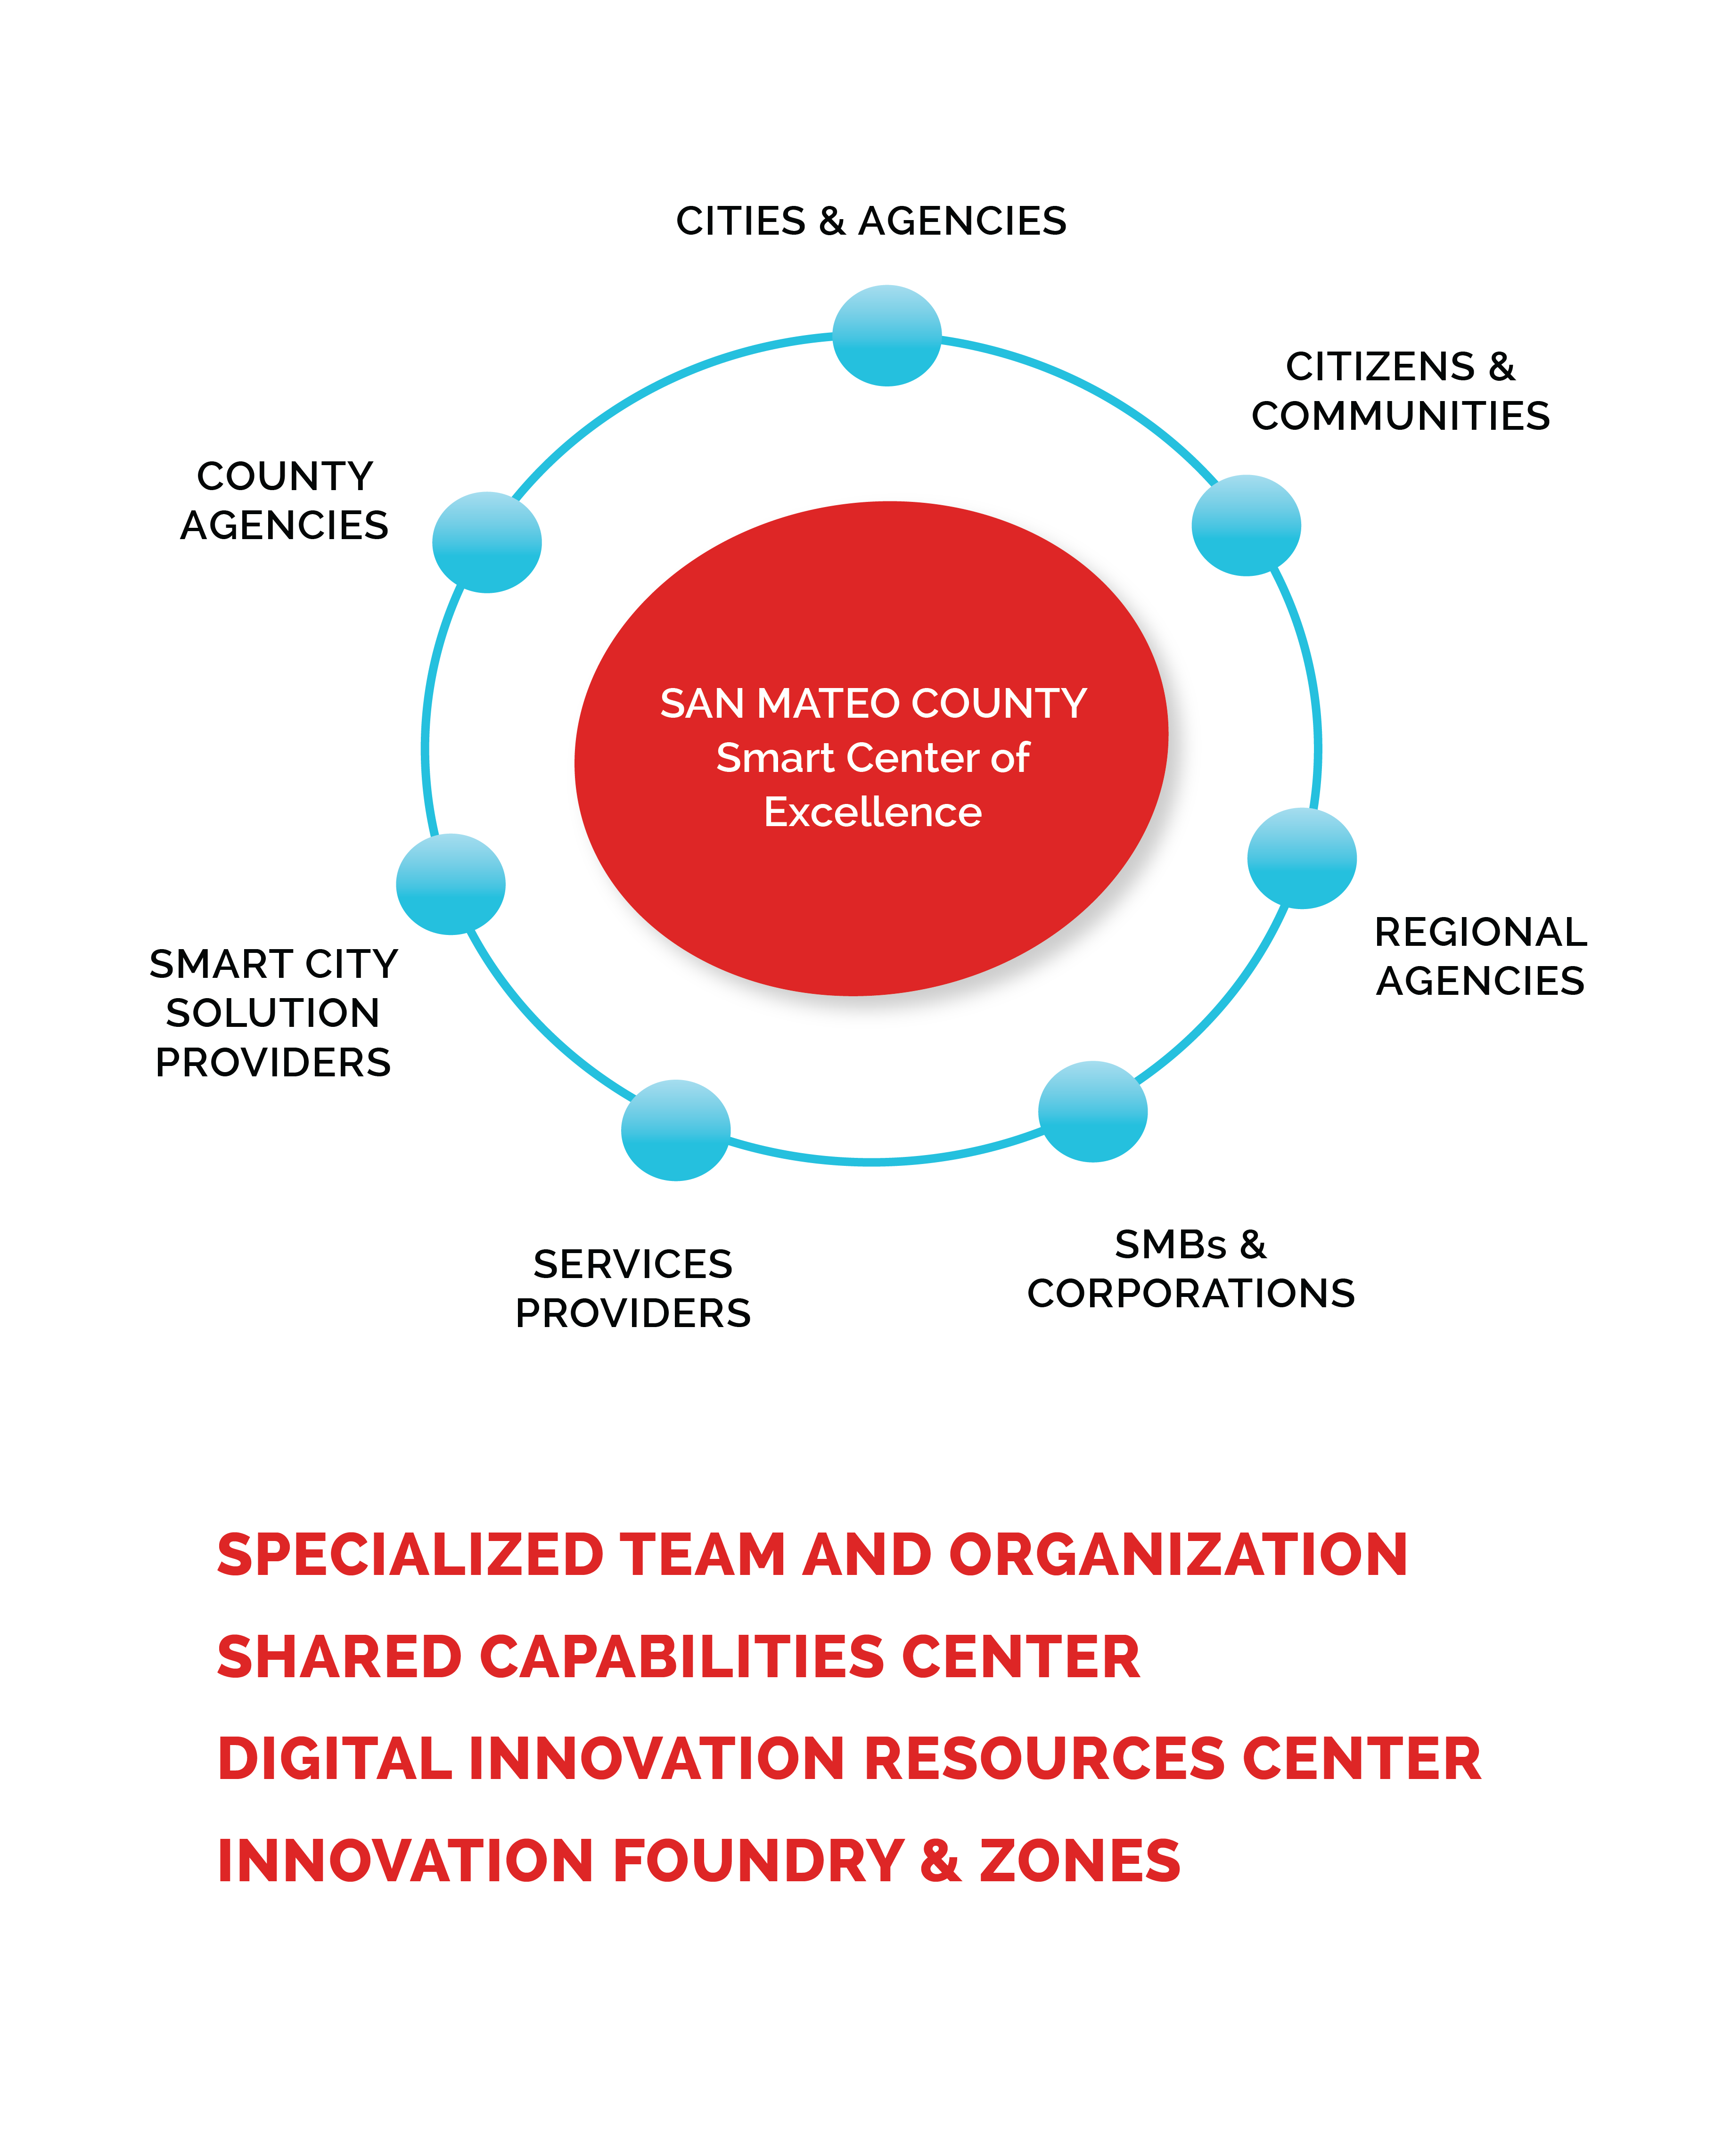 Approach/Solution: The San Mateo County smart region was built on the Strategy of Things Smart City Ecosystem Framework. The county provides a collaborative approach to innovation through a Smart Center of Excellence and innovation lab. Innovations are focused on seven key areas - Quality of Life, Public Safety, Mobility, Environmental Sustainability, Health and Wellness, Government Efficiency and Economic Development.
Result/Outcome: The first phase of Smart Region strategy was completed in nine months, with the operationalization of the SMC Labs in May 2018. Subsequent phases of the strategy are ongoing.
Additional Information:
- SMC Labs presented at GITEX (Dubai)
- Article: Scaling Smart City Tech Could Help Clear Regional Obstacles
- Press Release: County launches first-of-its-kind Smart Region innovation center
- Strategy of Things Smart City Ecosystem Framework overview (postcard)
Innovation Lab Design and Operationalization
![]()
Situation: SMC Labs is the digital innovation lab for San Mateo County's smart region initiative. The lab is envisioned to be the "smart" innovation hub for the 20 cities and 29 county agencies within San Mateo County. The lab teams will provide the digital and innovation expertise to supplement city and county agency teams.
SMC Labs is newly launched, and needs to operationalize quickly and make a measurable impact in order to gain internal support, credibility and budget for continued operations.
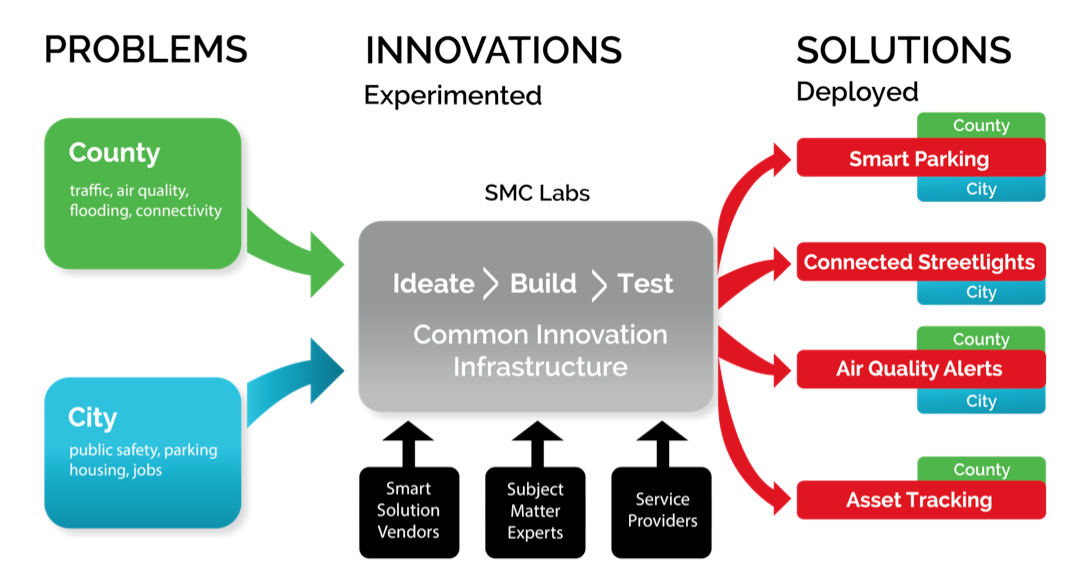 Approach/Solution: We designed SMC Labs from the ground up to solve problems. We developed and implemented problem solving and innovation methodologies. We built two local innovation zones where solutions can be piloted in a live environment - one at the San Mateo County Government Center, and the other at the East Palo Alto City Hall complex. In addition, we established a multi-connectivity approach to future-proof the lab as connectivity technologies are still emerging. We built (and continue to build) an ecosystem of solutions providers, subject matter experts and services providers that the lab can bring in to solve problems.
Result/Outcome: SMC Labs was launched in May 2018. The lab is currently operational and is planning and conducting several pilots. In addition, the lab continues to solicit and evaluate needs from various cities, county agencies and solution providers for future projects. Strategy of Things is a strategic part of the lab and is currently involved in the day to day lab operations.
Additional Information:
- SMC Labs Case Study (presented at GITEX 2018)
- SMC Labs One Year Update (presented at IoT World 2019 conference)
- SMC Labs website
- Ten innovation lab best practices (SoT Insights)
- SMC Labs overview (postcard)
Connected and Intelligent Streetlight Strategy
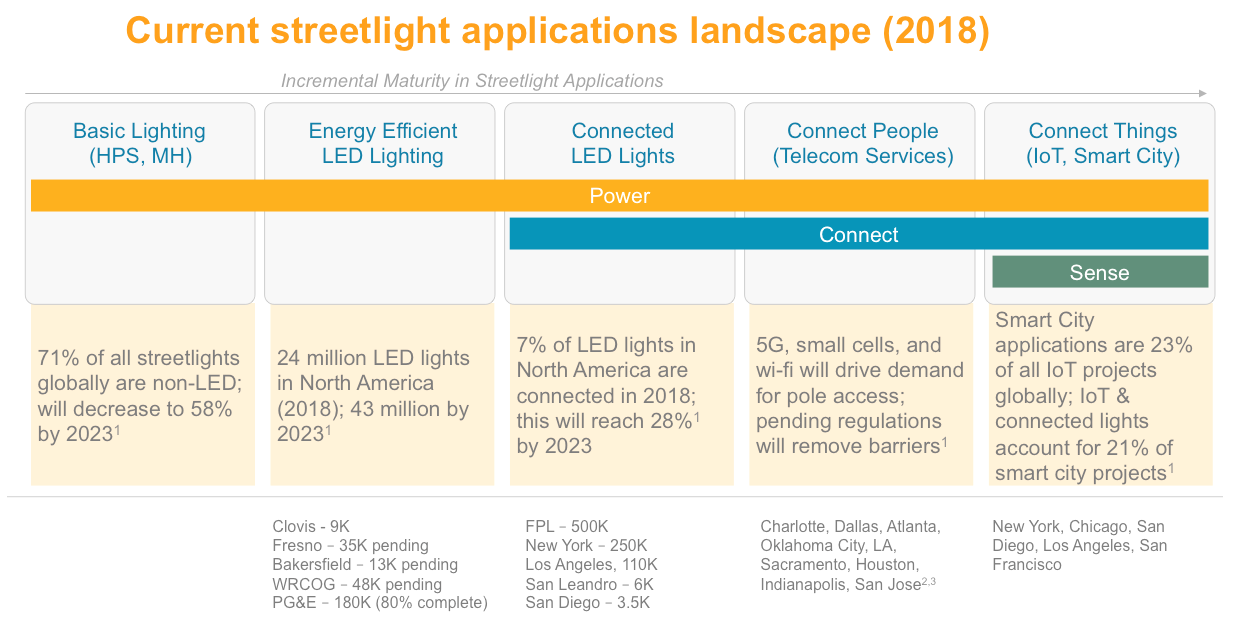
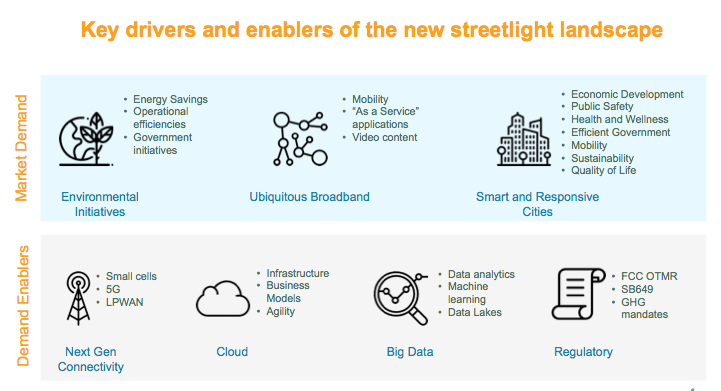 Situation: IoT and other "smart" technologies transform how a large Northern California regional utility company manages and maintains its streetlights. The utility company is faced with the question of how to incorporate and mainstream this innovation into its streetlight asset portfolio, align it with other corporate priorities and create an actionable strategy and plan that can be presented to executive management for funding.
 Approach/Solution: We assessed the utility company's internal capabilities and regulatory constraints against customer needs and opportunities to identify, how, where and when the company should incorporate smart connected streetlight technologies. In addition, we built a framework that aligned three disparate internal initiatives - connected streetlight operations, telecommunications services and smart communities/smart cities.
Result/Outcome: The strategy was completed in three months and was delivered on September 2018. The utility company was provided with:
- A new vision and mission for its streetlight operations organization that leverages the transformational potential of smart digital technologies on its people, processes, technology and policies
- A three phase strategy and seven year roadmap implementing and operationalizing connected streetlight across 200+ cities and towns in its service territory
- New business models and service offerings that are enabled by the implementation of connected and smart streetlights
Smart Parking – EV and Disabled Spaces
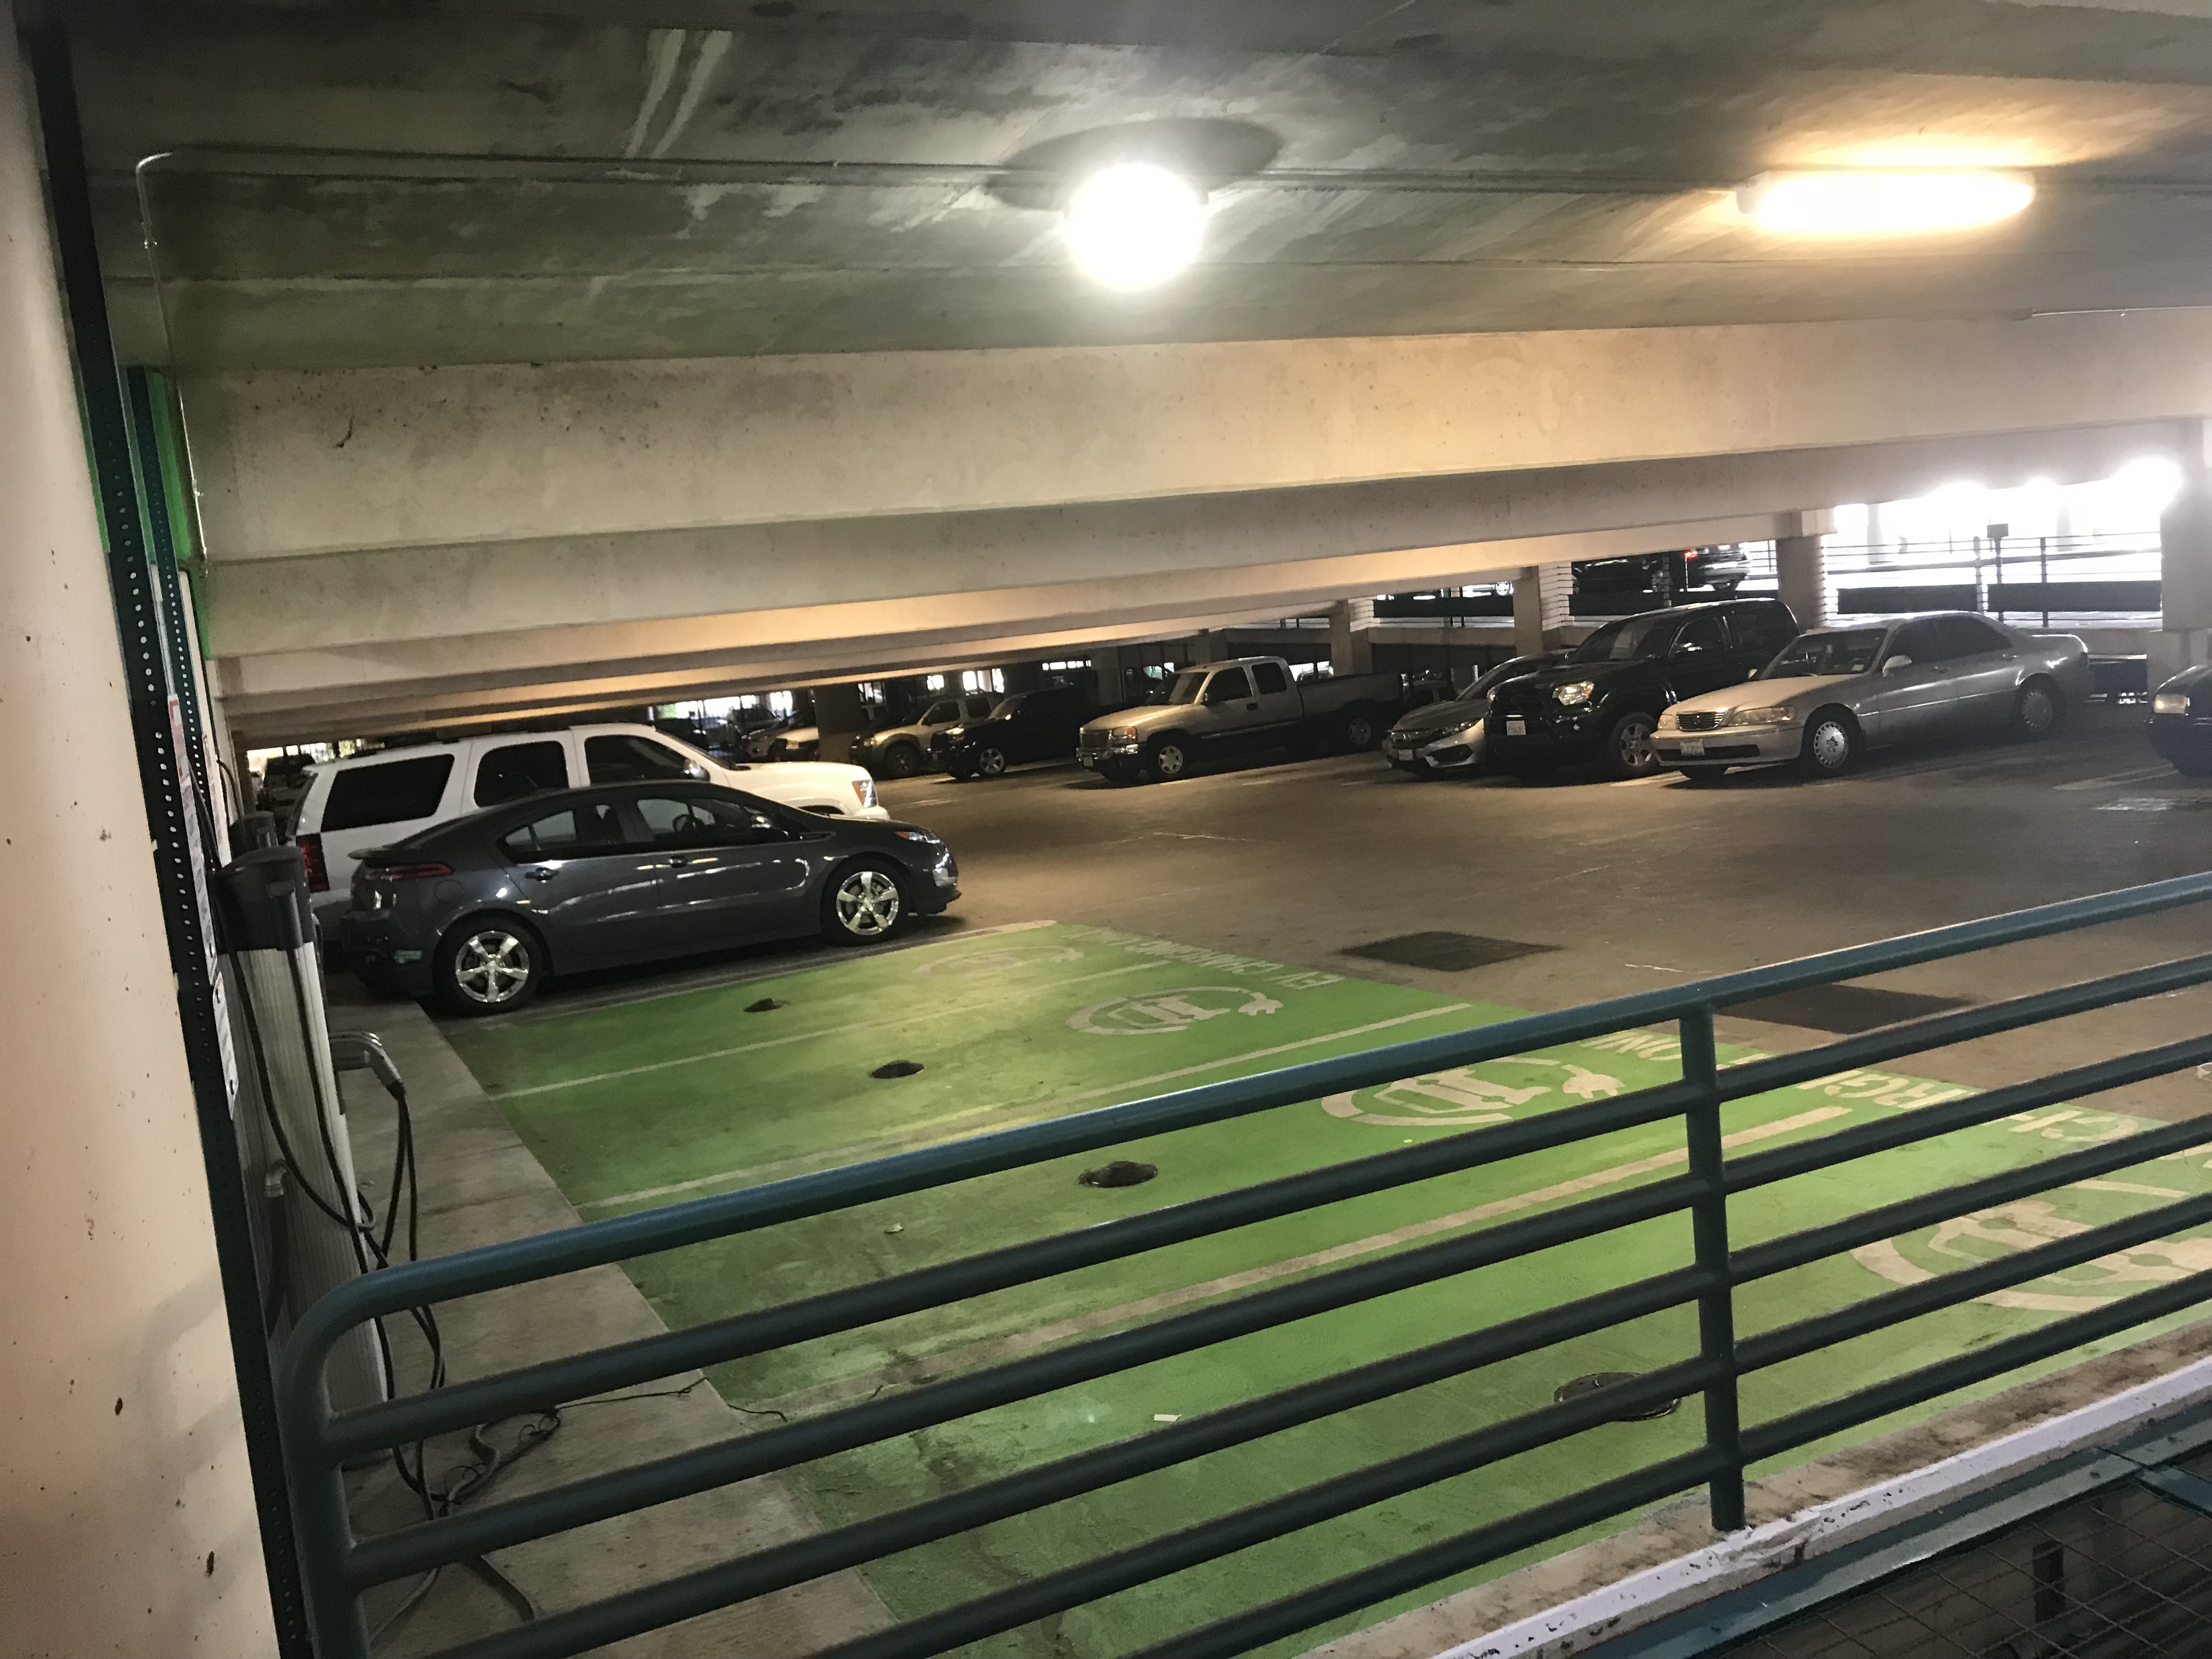
 Situation: The San Mateo County Government Center is located next to downtown Redwood City. In addition to county employees, the government center hosts hundreds of visitors everyday. These visitors come for a variety of reasons - from jury duty to conducting business with the county. There is an onsite parking garage, but parking availability is limited at times. In particular, the county wishes to address the needs of two categories of drivers:
- Drivers with disabilities may voluntarily limit their mobility to certain areas because they are not sure if they can park their car nearby.
- Drivers with electric vehicles may leave those cars at home and drive their gasoline powered vehicles because they don’t know where the EV charging stations are, and whether it is available.
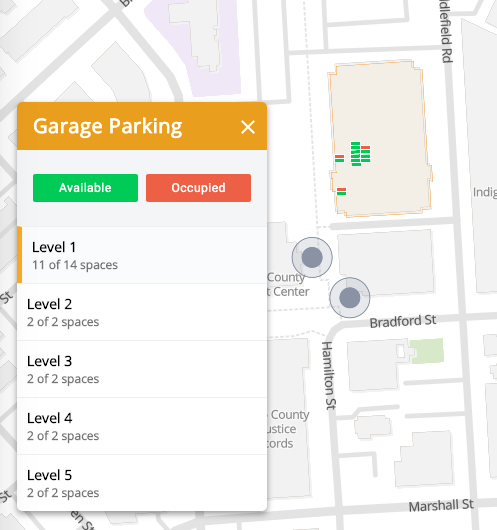
 Approach/Solution: The smart parking pilot utilized the Fybr Smart City platform. Twenty-two in ground sensors were placed in public and employee parking EV and Disabled spots. Alexa voice integration was enabled to test alternative user experiences. While the pilot solution had a real time and historical insights dashboard, we generated our own analytics from the raw data collected.
Result/Outcomes: The smart parking pilot was launched on June 2018 and is ongoing. A six month progress report was published on SMC Labs website. Key learnings to date include:
- There were generally sufficient parking during core hours at the moment. The garage is underutilized during non-core hours and more communications is necessary to encourage residents of surrounding apartment complexes to use the EV charging stations.
- Garages present unique challenges to smart parking solutions. The presence of significant amounts of concrete and rebar limits the range of IoT connectivity gateways, and more careful site selection and prep is necessary.
- Voice commands and response is a safer and more natural way to interact with the parking solution while driving and searching for spaces. However, voice commands need more maturing in order to be fully useful in a live environment.
Additional Information: Six month smart parking pilot update (from SMC Labs website)
Community Air Quality Monitoring Network
 Situation: Air quality (AQ) levels vary widely across the San Francisco Bay Area. These levels vary from city to city, neighborhood to neighborhood, and from street to street. However, the Bay Area Air Quality Management District (BAAQMD), the regional air quality district for the nine county San Francisco Bay Area, has a total of 36 air quality sensors. Half of these measure particulate matter (PM), the most commonly measured air quality parameter. In San Mateo County, there is only one BAAQMD PM sensor node.
The effects of the smoke from the northern California wildfires on 2017 and 2018 have increased the need for local air quality monitoring. This information can then be used to provide guidance at a local and neighborhood level, instead of a regional level.
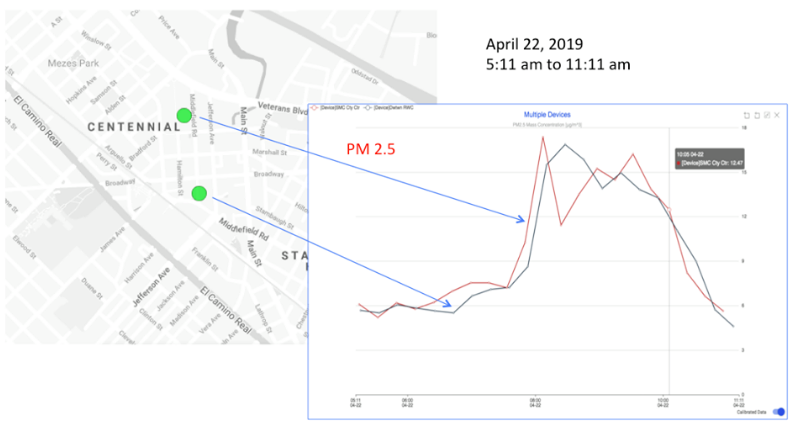 Approach/Solution: This pilot utilized a range of lower cost air quality sensors, including consumer grade, commercial grade and industrial grade. Phase One was deployed with three low cost commercial sensors connected to the Fybr Smart City platform. Phase Two used ten air quality commercial sensors from Clarity. In other phases, we will be deploying mobile mounted sensors and industrial grade sensors. The data collected from the sensors is made available through each vendor's dashboard. However, the eventual goal is to consolidate the data feeds into a single unified San Mateo County dashboard for analysis and presentation.
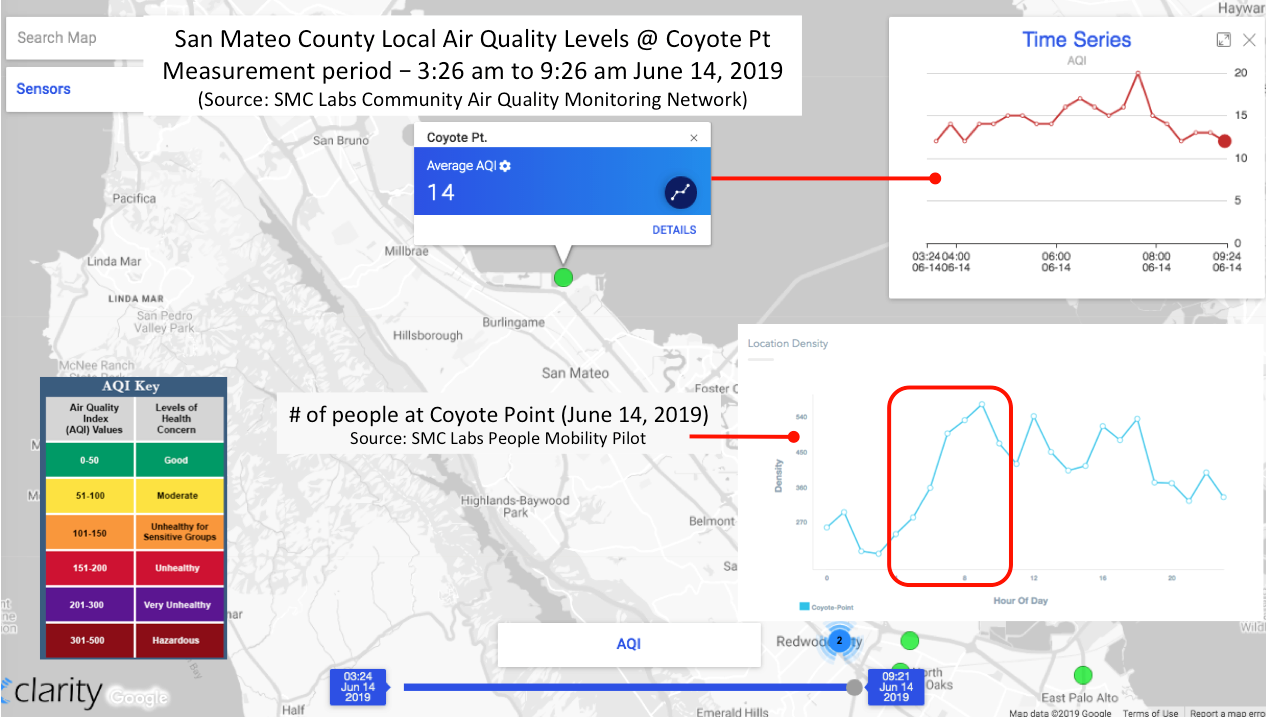
Result/Outcomes: The community air quality monitoring network pilot was launched in March 2019 and is ongoing. Initial testing and monitoring have confirmed that "local" emissions events can be detected that would otherwise not be monitored and documented.
Two air quality nodes were co-located at sites with the people and mobility patterns pilot. Co-location of these two use cases enabled the air quality levels and the number of people impacted at the sites to be determined.
The San Mateo County community air quality sensor network was added to the Clarity air quality open map. This map displays the air quality readings from sensors around the world.
People and Mobility Patterns
Situation: Urban planners, public safety, transportation and economic development officials have limited awareness of how pedestrians, visitors and commuters move around within a city and selected areas. This lack of understanding results in services that don’t match people’s expectations, suboptimal citizen engagement and experiences. In addition to public agencies, merchants and other commerce organizations have a desire to understand visitor patterns. This helps to identify and create services that will enhance their offerings and improve business opportunities.
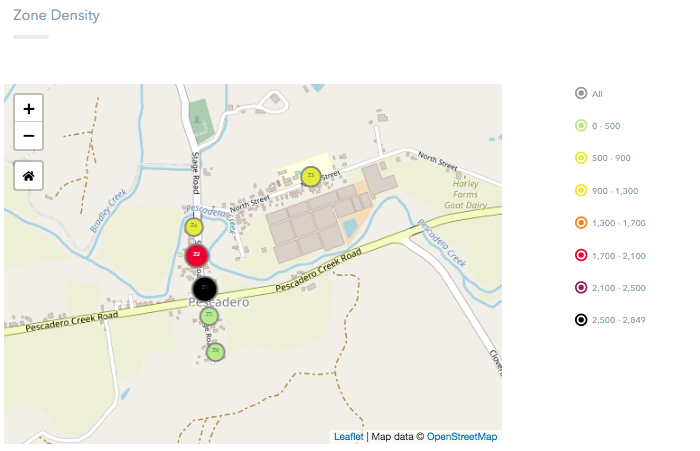 Approach/Solution: The solution employs the RadioLocus mobility analytics cloud platform. Data from mobile device users are collected through San Mateo County's public wi-fi access points within the collection zones, anonymized, sent to the RadioLocus cloud, and analyzed in aggregate. The information is then presented in a dashboard format. Two sites have been selected as test sites through San Mateo County. Some test sites have the community air quality sensor node installed, which we will be able to correlate the data from two separate use cases together.
Result/Outcomes: The pilot started on June 8, 2020 and ended on September 23, 2020. Overall pilot was successful in providing insights into the test setup, the technology, the results and identification of potential civic beneficiaries. Key highlights:
- Technology generally works as advertised and mobility patterns were obtained. Optimization of the algorithm is required in order to understand what is a "valid" count based on what is being measured and the actual test location.
- Access points are generally placed to maximize wi-fi coverage, and are not placed for location triangulation. When planning to use access points to both wi-fi coverage and location analytics, access point placement needs to consider the needs of both applications.
- The combination of the data sets from two separate use cases - the location analytics and air quality pilots, added new value. Combining the location analytics data to the air quality allowed us to see not only the local air quality conditions, but now we know how many people were in the immediate area that were impacted by the air quality levels.
- Location analytics solutions leveraging wi-fi access points have pros and cons. The advantages include not having to buy new hardware, and activation is done through the existing wireless controller. The disadvantages is that the access point location is already pre-determined (and may not be ideal from a location analytics placement perspective). From a citywide scalability perspective, it has limited scalability unless the city has citywide wi-fi. An alternative approach is to use self-contained wireless signal detectors, but to be effective, these need to have its own power supply (solar + battery), and its own backhaul (cellular). Such a setup would be very scalable, not dependent on the city for backhaul and power.
Additional Information: Location analytics post pilot report (pdf)
Municipal IoT Network Connectivity Decision Guide
 Situation: Connectivity is one of the enabling layers of the smart city. However, smart city planners are faced with a confusing multitude of connectivity options in emerging market. Some connectivity options operate in the licensed (or regulated) frequency bands, while others operate in the unlicensed or unregulated spectrum. Some options are capable of supporting large amounts of data such as video traffic while others can only pass through very small amounts of data. Some are capable of transmitting over several miles while others are good for thirty feet.
While many options in the market today will narrow to a more manageable few in the future, the reality remains - there is no “one size fits all” or universal connectivity option that will fit all the different use cases. In many cases, planners will need to have multiple connectivity options operating concurrently. Given the current environment, how do smart city planners determine the best connectivity option?
Approach/Solution: We developed a structured process for narrowing down the smart city connectivity choices to a manageable few. This process calls for identifying the possible use cases, verifying what existing connectivity services are available, filter it against various management and operational considerations (build/buy, skills, capabilities, etc.), then furthering evaluating it against various technical and other considerations (licensed/unlicensed, open/proprietary, maturity, etc.). A weighting methodology is used to objectively score and rank the options.
Result/Outcomes: This work is complete. It was started in August 2018, as part of the National Institute of Standards and Technology (NIST) Global Cities Team Challenge (GCTC) Wireless Supercluster. The IoT connectivity decision guide is published as part of the Municipal Internet of Things (IoT) Blueprint in July 2019 and is available here. This work will be presented at the Smart and Secure Cities and Communities Challenge Expo in Washington DC in July 2019.
Additional Information: Municipal IoT Blueprint 2019
Smart Cities Market Scan and Best Practices Research Study
Situation: The client was planning a smart city program, but had limited understanding and awareness of the current trends, projects and best practices of what other cities were doing. Without this basic background knowledge and baseline as a starting point, it was not possible to plan a successful smart city program.
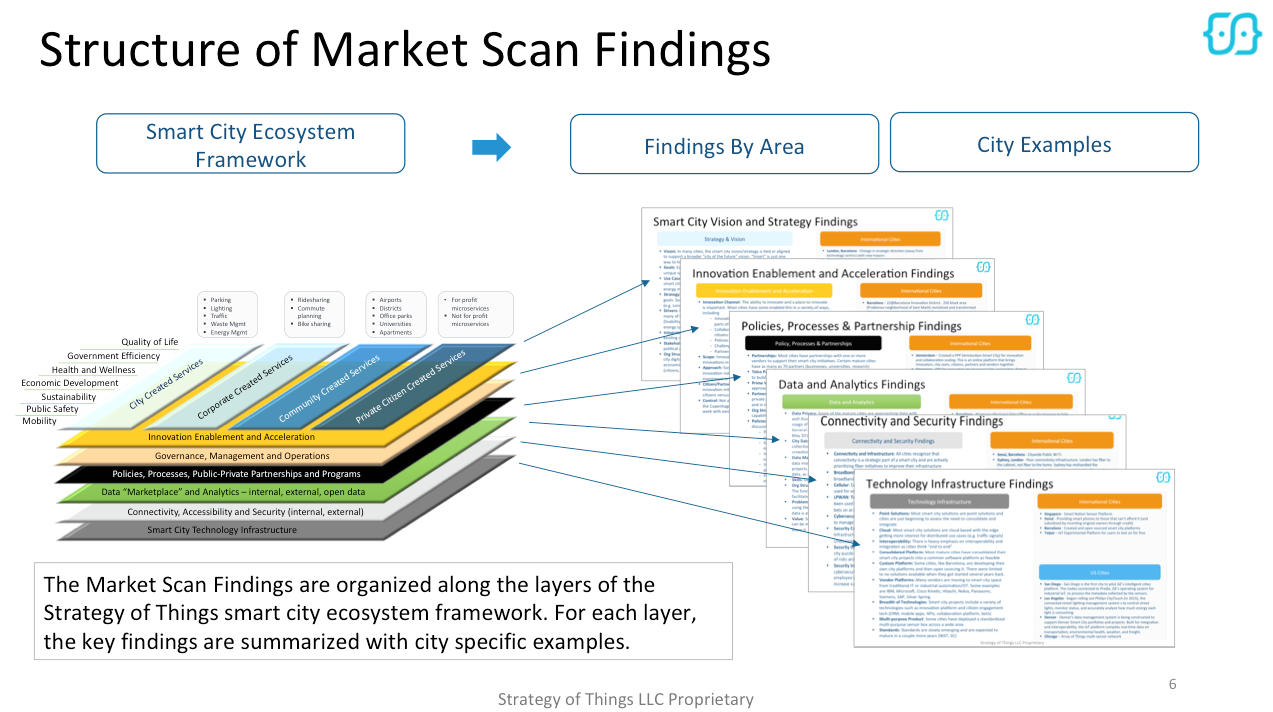 Approach/Solution: We used the Strategy of Things Smart City Ecosystem Framework as the basis for the research categories and topics. We studied 18 cities in the United States, and 10 cities outside the United States. The cities ranged in population from under 500K to over 10 million.
We collected information through a limited number of primary interviews and supplemented that with secondary research using a variety of publicly available sources, including press releases and news articles, reports published by other researchers, and podcasts and video interviews. We consolidated this information, analyzed and synthesized it and organized it along the layers of the Smart City Ecosystem Framework.
Result/Outcomes: This work is complete and delivered in March 2018. A shareable version of this research is available here. In this report, we developed an overview of the top smart city trends, program approaches, use cases, vendor partnerships, and lessons learned.
In August 2019, we added the Community Engagement layer to our Smart City Ecosystem Framework. We are currently conducting research in how these cities are doing community engagement, and will be updating our research report. Target completion date is end of October 2019.
Additional Information:
IoT Technology Infrastructure Gaps and Future Federal Research Investments
Situation: In Fiscal Year 2017, the United States Federal Government invested over $140 billion in federally‐funded research and development (R&D). Over $50 billion of this research was conducted at nearly 300 government-owned, government-operated (GOGO) and government- owned, contractor-operated (GOCO) laboratories across the country. Some of this work will yield extraordinary long‐term economic impacts through the generation of new knowledge and job‐creating technological breakthroughs that support U.S. competitiveness in the global economy.
Internet of Things (IoT) technologies bring enormous disruptive and beneficial impacts to national security, economic prosperity, human safety and well-being. These impacts are felt across industries and markets, from healthcare, manufacturing, transportation, energy, cities and more. Because of this, IoT has been identified as one of the growing areas of federal R&D investments and federal technology transfer or the “Lab-to-Market” process. However, like many early-stage technologies that federal laboratories focus on, it can take ten or more years to move an IoT related technology from incubation to market maturation.
The United States National Institute of Standards and Technology (NIST) plays a critical leadership role within the federal ecosystem in promoting U.S. innovation, competitiveness and economic prosperity and security through programs, studies, research and standards. Given the strategic importance of IoT and in support of the President's Management Agenda Cross Agency Priority Goal 14, NIST wants to understand the current state of IoT research efforts, the top technology infrastructure gaps, and where future federal government research investments should be made in order to accelerate the adoption, deployment and economic benefits of IoT. With this understanding, NIST can develop the necessary programs, initiatives and investments to create these outcomes.
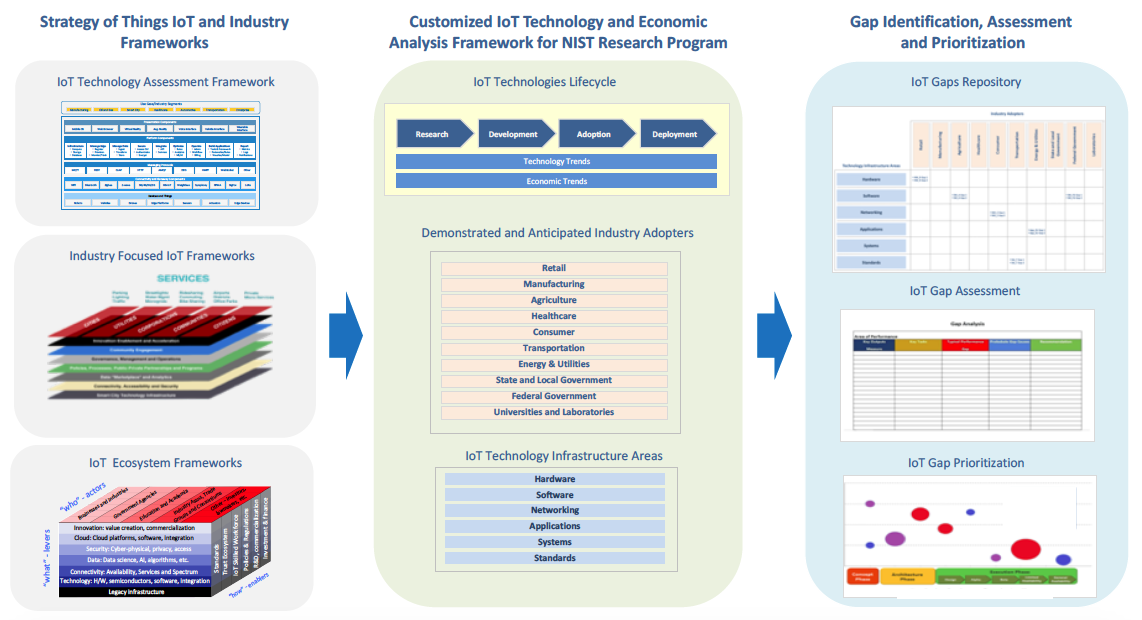 Approach/Solution: We utilize a six step approach for this project. We start by refining and adapting our existing IoT and industry ecosystem frameworks and models to create one that is appropriate for this project. With that in place, we conduct the primary and secondary research across the relevant federal, academic, industry IoT ecosystem. Information collected will be used to identify the key infrastructure gaps. An economic impact model, developed specifically for this project, is then used to quantify the industry impact of closing these gaps. We then disseminate our findings and results broadly across the federal government, academia and industry through a variety of channels, including publications, speaking engagements, journals, online and digital means, social media, press, industry working groups, standards bodies, conferences and trade associations.
Result/Outcomes: This project was awarded to Strategy of Things in September 2019 by the United States National Institute of Standards and Technology's (NIST) Technology Partnerships Office (part of the Department of Commerce). The project will start in October 2019 and goes to September 2021. Results from this study, when available, will be published and disseminated widely in a number of scientific and industry publications and conferences.
Additional Information:
- Project Website
- Press article: Where Is IoT Headed? NIST Looks at Gaps in Research, Infrastructure
- Announcement of Award
- NIST "Lab to Market"
- President's Management Agenda (abridged, showing Goal 14)
- President's Management Agenda (full version)